 lop News
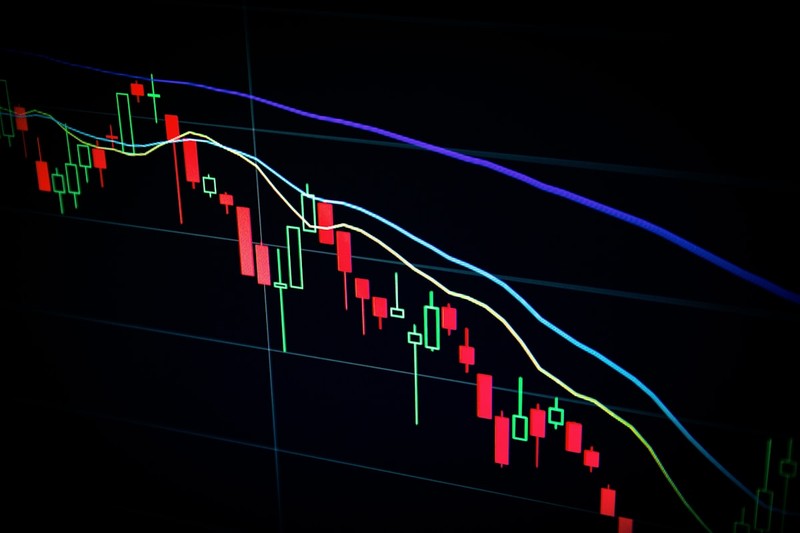
The selloff that started as a rough week has become something uglier.
On Friday the Nasdaq Composite dropped 2.01% to 21,647.61, landing 9.3% below its January 28 all-time closing high of 23,857. The Dow shed 443.96 points — or roughly 1% — to close at 45,577.47, now 9.2% off its February 10 peak. Both indices briefly dipped into correction territory during the session before clawing back just enough to close shy of the 10% line.
The Russell 2000 had no such reprieve. The small-cap index fell more than 2% and crossed the threshold outright.
The Numbers That Matter
The S&P 500 lost 1.51%, finishing at 6,506.48 and slipping below its 200-day moving average for the first time since June — a technical signal that tends to concentrate minds on trading desks. Brent crude, which briefly kissed $119 per barrel on Thursday, settled Friday at $112.19 after Iraq declared force majeure at all foreign-operated oilfields and drones struck two refineries in Kuwait.
Every one of those data points traces back to the Strait of Hormuz, where tanker traffic has ground to a near halt. Reports that the Trump administration is weighing plans to blockade or occupy Iran’s Kharg Island — the country’s main oil export terminal — only deepened the selling pressure.
“The Fed’s balancing act is getting trickier,” BondBloxx’s senior investment strategist told Yahoo Finance, summing up a market caught between war-driven inflation and vanishing rate-cut expectations.
Earlier today this publication noted that stocks, bonds, and gold were all falling in tandem — a rare alignment that signals investors fleeing risk rather than rotating into safety. Friday’s close confirms the pattern has intensified, not resolved. The question is no longer whether markets are rattled. It is whether the next session opens inside correction territory or deeper.